TreeGrid

EJS TreeGrid is a DHTML component
written in pure JavaScript to display and edit data in table,
grid, tree view, tree grid or bar chart on HTML page.
It is the fastest AJAX grid with the richest features set available on the Internet.
More information
Gantt chart


TreeGrid Gantt chart is an application core for building online (web based) project management software like
MS Project or Oracle Primavera.
It is the most complex web Gantt chart and universal bar chart on the Internet.
More information
SpreadSheet
TreeGrid SpreadSheet is an application core for building online (web based) spreadsheet software like
MS Excel, OpenOffice Calc or Google Sheets.
It is complex and fully customizable web spreadsheet with huge features set.
More information
News
2024-06-21Major version 17.0 released.
TreeGrid code rewritten to be compatible with Content Security Policy and no more requires unsafe-inline directive.
TreeGrid has been updated to work in third party online frameworks like SalesForce LWC.
Added various features for code and html isolation and to permit placing TreeGrid under shadow DOM.
2021-07-15Major version 16.0 released.
Gantt chart can be exported to xlsx as chart with all objects, icons, lines and backgrounds.
Gantt Run Containers can have assigned dependencies and can be automatically scheduled.
By Tags is possible to display and edit value of range cell in visually separated and marked tags.
And various minor features and updates in Grid, Gantt and Sheet.
2020-04-21Major version 15.0 released.
Added rich text / HTML editor with all standard style features like bold / italic style, underline / overline / strike including color and style lines, border, text color, shadow and background,
text horizontal and vertical alignment and subscript / superscript, font size and name and inserting images and links.
Added inserting and editing images into TreeGrid cells and also as floating outside cells. Images can be downloaded and uploaded in cell values or attributes in "data:".
Rewritten xlsx import and export; Full support for JSON format; Compiling all TreeGrid files into standalone GridE.js; Automatic row and column tree;
Dynamic locks; Different contrast in CSS styles; Dynamic freezing rows and columns; Preview of page breaks for printing.
And many minor features and updates in Grid, Gantt and especially in Sheet.
See what is new
Live examples
 1
1
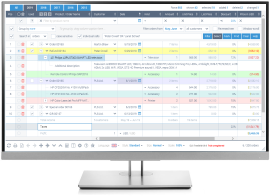
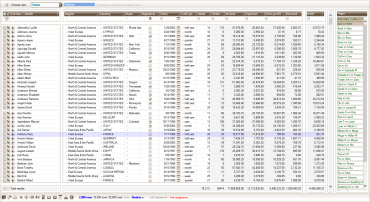
TreeGrid universal example
A demonstration of many TreeGrid features like
tree, sorting, grouping, filtering, searching,
calculations, resizing and moving columns,
row dragging, adding, deleting, copying, selecting,
fixed rows and columns, many cell types,
formatting values, popup default list, calendar,
printing, export to PDF, export to MS Excel.
show live example
 2
2
Gantt chart & Network diagram
A demonstration of TreeGrid application showing
interactive Gantt chart - timetable of tasks
and their completion, resources, dependencies
and scheduling in project management
and also interactive Network diagram of the same taks with desriptions and dependencies.
Shows also printing and export to PDF.
show live example
 3
3
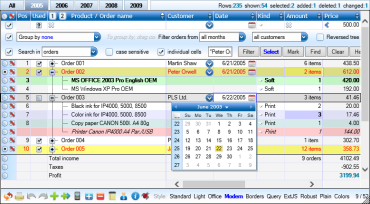
TreeGrid large paged example
A demonstration of large grid with 50,000 rows.
Shows various pagers and paging types
with loading and rendering pages on demand.
Shows sorting, grouping, filtering and calculations.
Supports modifying data and saving changes to server.
Shows also printing and exporting to XLSX/XLS/CSV.
show live example
 4
4
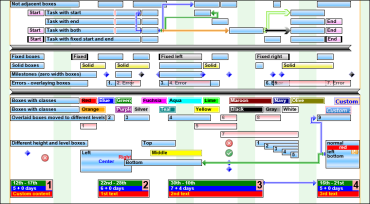
Universal interactive bar chart
A demonstration of interactive bar chart done by Run.
The individual bars can have different size, style, shape, icons, color, HTML content, tooltip and features.
It shows various types of creating, deleting, moving, copying, selecting and changing the boxes.
The boxes support also dependency lines.
show live example
 5
5
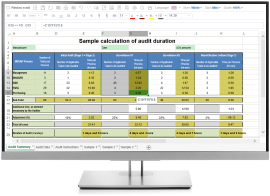
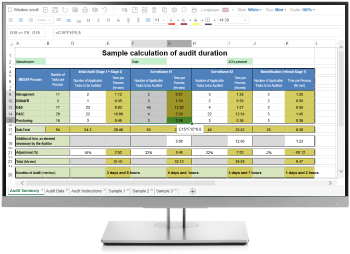
TreeGrid SpreadSheet example
A demonstration of cell based spreadsheet program
Shows editable formulas with suggest menu and choosing cell range during editing; Row and column index; Auto adding new rows and columns on scroll; Dynamic cell border; Dynamic cell style; Dynamic and automatic cell format and type; Mass changes like Clear, Move, Copy, Paste, AutoFill with all cell attributes.
show live example
 6
6
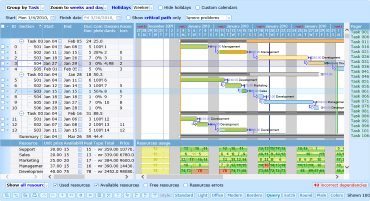
Large paged Gantt chart
A demonstration of TreeGrid application showing
interactive Gantt chart with 1000 rows / tasks using client side paging with pager.
It shows standard Gantt features like tasks completion percentage, dependencies between tasks, task scheduling, critical path, task resources and resource charts, calendars with holidays.
It shows also times spent by individual actions.
show live example
 Buy
Buy
 Try it free


